Rideshare Data Explorer
An app visualizing a public rideshare dataset of ~900K trips in the city of Austin, TX from May 2016 to Feb 2017.
Front End
The frontend is built with React.
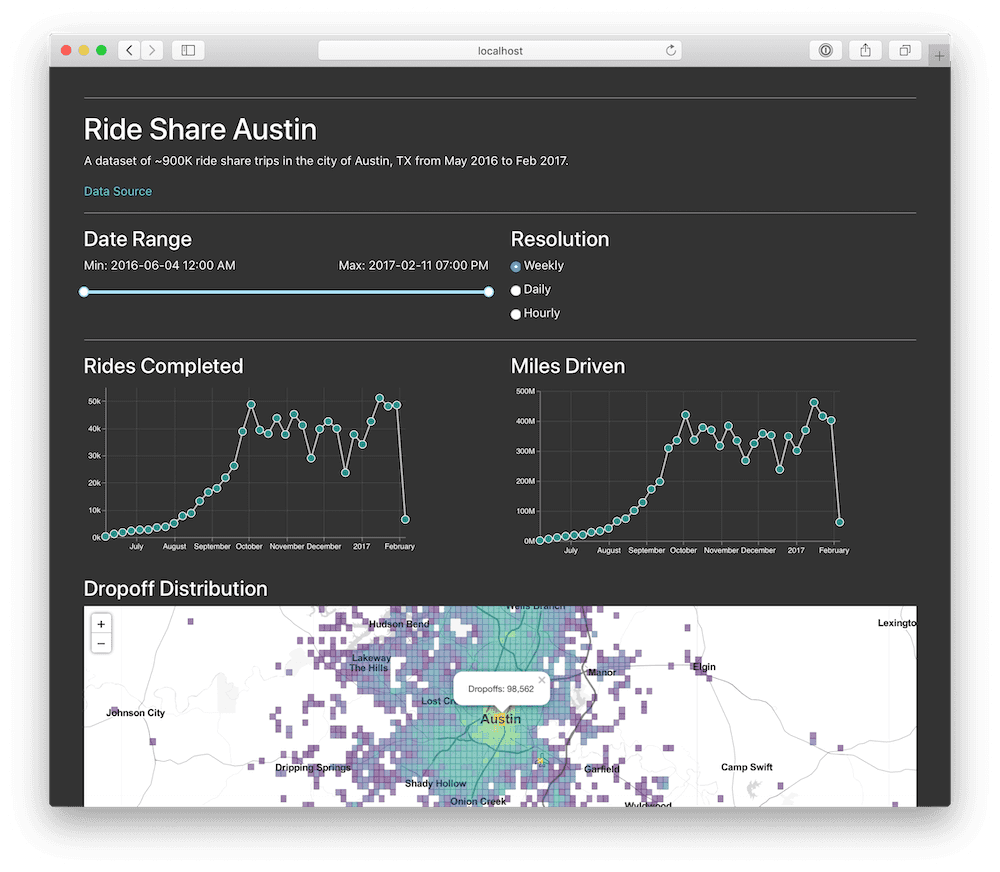
Vega-lite is used for the two line plots using precalculated timeseries. I’ve been using Vega-lite a lot recently and have been enjoying how quick it is to use.
The map is made with Leaflet with D3 handling the color scale for the choropleth tiles.
The scale is log min-max in order to maximize the color differentiation. Otherwise, the entire map would be purple except for a couple yellow spots in downtown and the airport. I chose the viridis colorscale since I’m keeping opacity constant across the tiles and the perceptual uniformity helps the eye spot patterns while not making any particular regions difficult to see.
Back End
I built a single table Postgres database and hosted it on AWS RDS. The database is accessible via a simple web API built with Flask.
I initially tried to fit the dataset into the memory of my Heroku dyno to save money and simplify the deployment, but it didn’t quite fit. I did learn that the Parquet format is really fast to load into memory, so I might start using it on future projects.